How to Read and Use a Histogram
Written by Daven Mathies
What is a histogram?
When trying to teach myself about something new, I always like to look first at the word itself, as this usually helps clarify what I’m actually working with. So, right click “histogram,” select “look up in dictionary,” and we get: ˈhistəˌgram, n. A diagram consisting of rectangles whose area is proportional to the frequency of a variable and whose width is equal to the class interval.
On second thought, that didn’t help me at all.
Like the term ISO (which we photographers recognize to be a measure of sensitivity) simply stands for the International Organization of Standardization, a histogram deserves its own definition as part of photography jargon. Basically, it is another way to judge exposure, by showing the distribution of pixels in an image from black to white. Some cameras will only show a histogram during image review, while many live-view cameras can display an active histogram while you shoot. On most cameras, the histogram is not displayed by default, so you may have to activate it in the menu or by scrolling through the display options during playback.
 Histogram: not at all like Instagram.
An unbiased opinion
I won’t go so far as to say digital photography has made us all lazy, but I will say it has made it easier for us to be lazy when we want to. Even for those of us who know better, we will still occasionally judge exposure based on how an image looks on our camera’s LCD screen. The problem with this is that the LCD screen only shows a fraction of the pixels in the image, plus, our eyes are very subjective. A light meter helps, but a light meter only looks for middle-gray—this can actually make exposures incorrect if you’re shooting, say, a polar bear in the snow.
A histogram, on the other hand, shows the entire contrast range of an image, and it shows only pure data—there’s no room for your own subjectivity to mess it up. A hundred people can look at the same histogram and they will see the same information (which may result in a hundred people scratching their heads, but that’s why we have articles like this!)
Making sense of the data

A histogram shows brightness on the horizontal axis from values 0 to 255, with shadows to the left and highlights to the right. The vertical axis does not show exposure, it simply shows the number of pixels at any given brightness value. The rule of thumb is that a “properly” exposed image will have most of the data heaping up in the center of the histogram, then falling off evenly toward both sides with just a tiny number of pixels at the minimum and maximum values.
 An evenly-lit scene with little in the way of dark shadows or bright highlights, and the accompanying histogram with most of the data in the middle.
Of course, like most rules in photography, this is really more of a guideline. As with our polar bear in the snow, some situations will have a vastly different histogram, one shifted to the right or the left depending on if it is a light or dark scene. Silhouettes may even yield a histogram with peaks on either side and a valley in the middle. The photographer must judge the scene, read the histogram, and make exposure adjustments for that particular scene.
 Exposing this image so that the majority of the data fell in the middle of the histogram would have resulted in a subject that was completely blown-out. A human brain is required to know when image data should be mostly to the left, center, or right of the histogram.
Keep in mind, even in our polar bear scenario, we shouldn’t have data going above 255 (past the right edge of the histogram). If your histogram shows data piling up on the right or left edges, it means your photo has “clipped” pixels—pixels too far outside the dynamic range of the sensor to be able to hold any detail. High-contrast scenes, such as sunsets, may force you to choose between sacrificing shadow detail or highlight detail, as the camera is simply incapable of capturing all the detail in the scene. This is where some people will use a graduated ND filter to even out the brightness in the scene, or shoot multiple images at different exposures to make an HDR composite.
 This silhouette has some really dark darks and some really bright brights, as evidenced by the peaks-and-valley histogram. It also works in post!
Photo editing software like Photoshop, Lightroom, Aperture, and even iPhoto will show histograms to help when making adjustments to your images in post-production. This allows you to see how much room you can safely increase or decrease exposure before clipping occurs. For low-contrast images, the histogram shows how far you can crush the blacks and/or push the highlights in order to increase contrast. Especially for those of you who haven’t profiled your monitor, the histogram is paramount to being able to correctly adjust exposure and contrast.
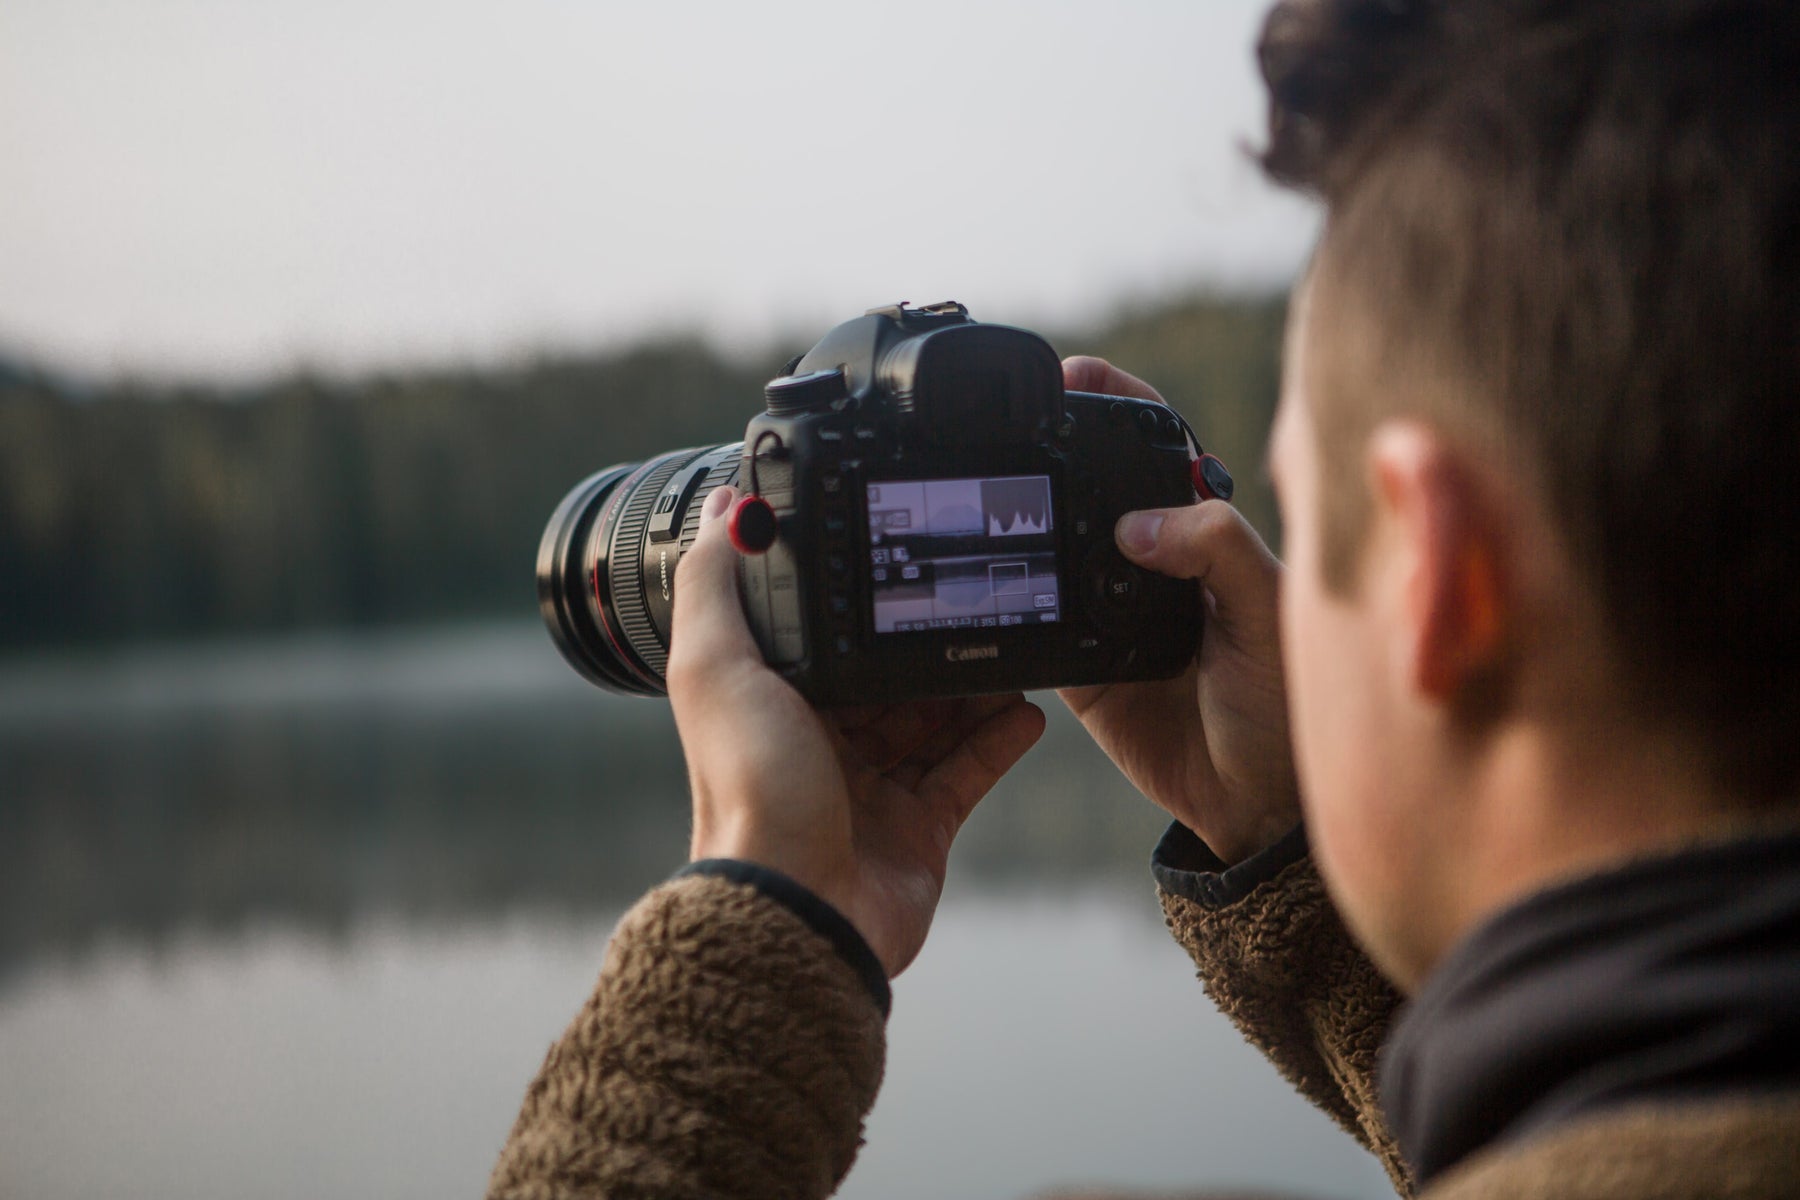
 A black camera in front of a backlit window presents a challenging scene, and is beyond the dynamic range of the camera taking the picture. Notice the large amount of pixels piling up against the right edge, as well as some pixels spilling off the left. Detail is being lost at both ends of the spectrum, and this would be tricky to fix in post.
One tool of many
I ignored using a histogram when I originally switched to digital. I had used a standard light meter for years, and didn’t see why that should change. To me, a histogram seemed like an unnecessary complication. After learning how to read it, however, I realized the truth is that a histogram simplifies the metering process by taking the guesswork out of it. I actually find myself better able to relax now that I know for sure if I am clipping my shadows or highlights. That said, if you look only at the histogram, it will fail you. A “correct” histogram will look different depending on the scene, and you have to watch out for making adjustments simply because you have some clipped data—small, point light sources in the background may be overexposed, but they may also be meaningless to the final image. It’s up to you, as the photographer, to see the forest and the trees. And when it doubt, it’s still never a bad idea to bracket. After all, it’s not like you’re wasting film.